In a forum I frequent one of the louder mouths routinely declares his state taxes and spends too much. I wanted to see if he was wrong as usual (he was), and to see how Vermont compared. It turns out Vermont is on the high side, but not in an obvious danger zone.
A note on the graphs: There were too many data points to make a bar chart useful, so instead I displayed the percentage for the various years above each state. It would be great if I could display the year instead of the value for each year, but this is what my software can do.
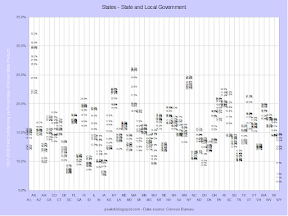
This first set of data comes from surveys of state and local governments done by the Census Bureau.
 Current expenditures covers most of what is considered "government" but not everything that state and local governments do. It excludes publicly-owned utilities like water (but not sewer or trash, which are often billed together), electricity, gas, transit, and state liquor stores. (I'm kidding about the last one being a utility. YMMV.) It also excludes expenditures by various state and local trust funds, which manage funds fo unemployment insurance, workers' compensation, government employee retirement, and others too small to classify. Vermont was consistently among the top spenders, averaging around 19% of gross state product.
 Current expenditures also excludes capital outlays, which can be seen in this graph. Vermont ranked below average for this type of spending.
 So where does that money come from? Taxes naturally are the biggest source for most states. Vermont consistently collected a larger percentage of gross state product than nearly every other state.
 States also collect a lot of fees for the various services they provide. Vermont ranks somewhat above average, but not by a lot. Alaska blows the scale due to oil revenues.
 Transfers from the federal government are the third big source of revenue. Transfer funds usually come in the form of block grants to implement programs mandated at the federal level. Vermont is doing a pretty good job of suckling at the federal teat.
 Finally, the debt outstanding. Unlike the federal debt, state and local debt is more or less under control. Also unlike the federal government, most of the state and local debt (apart from California) was taken on to fund capital projects, not current expenditures. Vermont has a slightly above average level of debt, but it's still manageable.
Now let's switch over to data from the Bureau of Economic Analysis.
 Gross state product is the regional breakdown of gross domestic product. These numbers are lower than the numbers from the Census Bureau would suggest. However, the previous set measures flows, while this set measures contribution to final demand. Vermont's state and local governments contribute to GSP by an above-average amount.
 Here's a scatter graph of state and local government verses per capita GSP. The moderately strong inverse trend makes sense - poorer states have more people who need government assistance.
 Here's the same graph for a few states. The left to right trend is due to the GSP data not being adjusted for inflation. Several of the series show a peak in 2003, which is when unemployment peaked during the last downturn. Unemployment will probably peak well after the economy starts to "grow" this time around, too.
What's the takeaway? Poorer states tax and spend relatively larger amounts. Beyond that, most states don't stray much from the average. Alaska and Wyoming are oddballs due to the relatively large amount of money they collect as oil royalties. Delaware is an outlier as well; numbers for that state might be skewed by the number of companies incorporated there. DC shouldn't be in this analysis at all.
Update: How about the federal government?
 Here's how much the federal government contributes to GDP in each state. Vermont looks distinctly average here. DC blows the scale for obvious reasons.
 The military contributes less than average in Vermont, which is unsurprising given the lack of large bases or ports. Hawaii is the outlier due to its location.
No comments:
Post a Comment